The true potential of SODAQ AIR is seen in numbers. With community-wide adoption, the AIR creates a complex network of interlinked air quality measurements reinforce the already existing solutions.
Both the AIR and the data it collects are open source. This gives everyone, everywhere access to the complete schematics of the device, and a global database of air quality measurements.
The portable air monitor
Breathe Smarter With SODAQ AIR
Each trip you take tells a unique story about the air quality, all of which you can access by inputting your AIR’s unique identifier into the Know Your AIR global map.
The aggregation of all the data in a 100×100 meter area, is averaged on an hourly basis and uploaded to the global map as open data. This creates a network of detailed air measurements across the globe while protecting user anonymity. (Read our privacy statement)
PM consists of tiny solid particles and liquid droplets, which are directly influenced by water levels in the air. To get an even better indication of day-to-day changes in air quality, the humidity sensors provide in-depth readings on these water levels.
Particle Matter
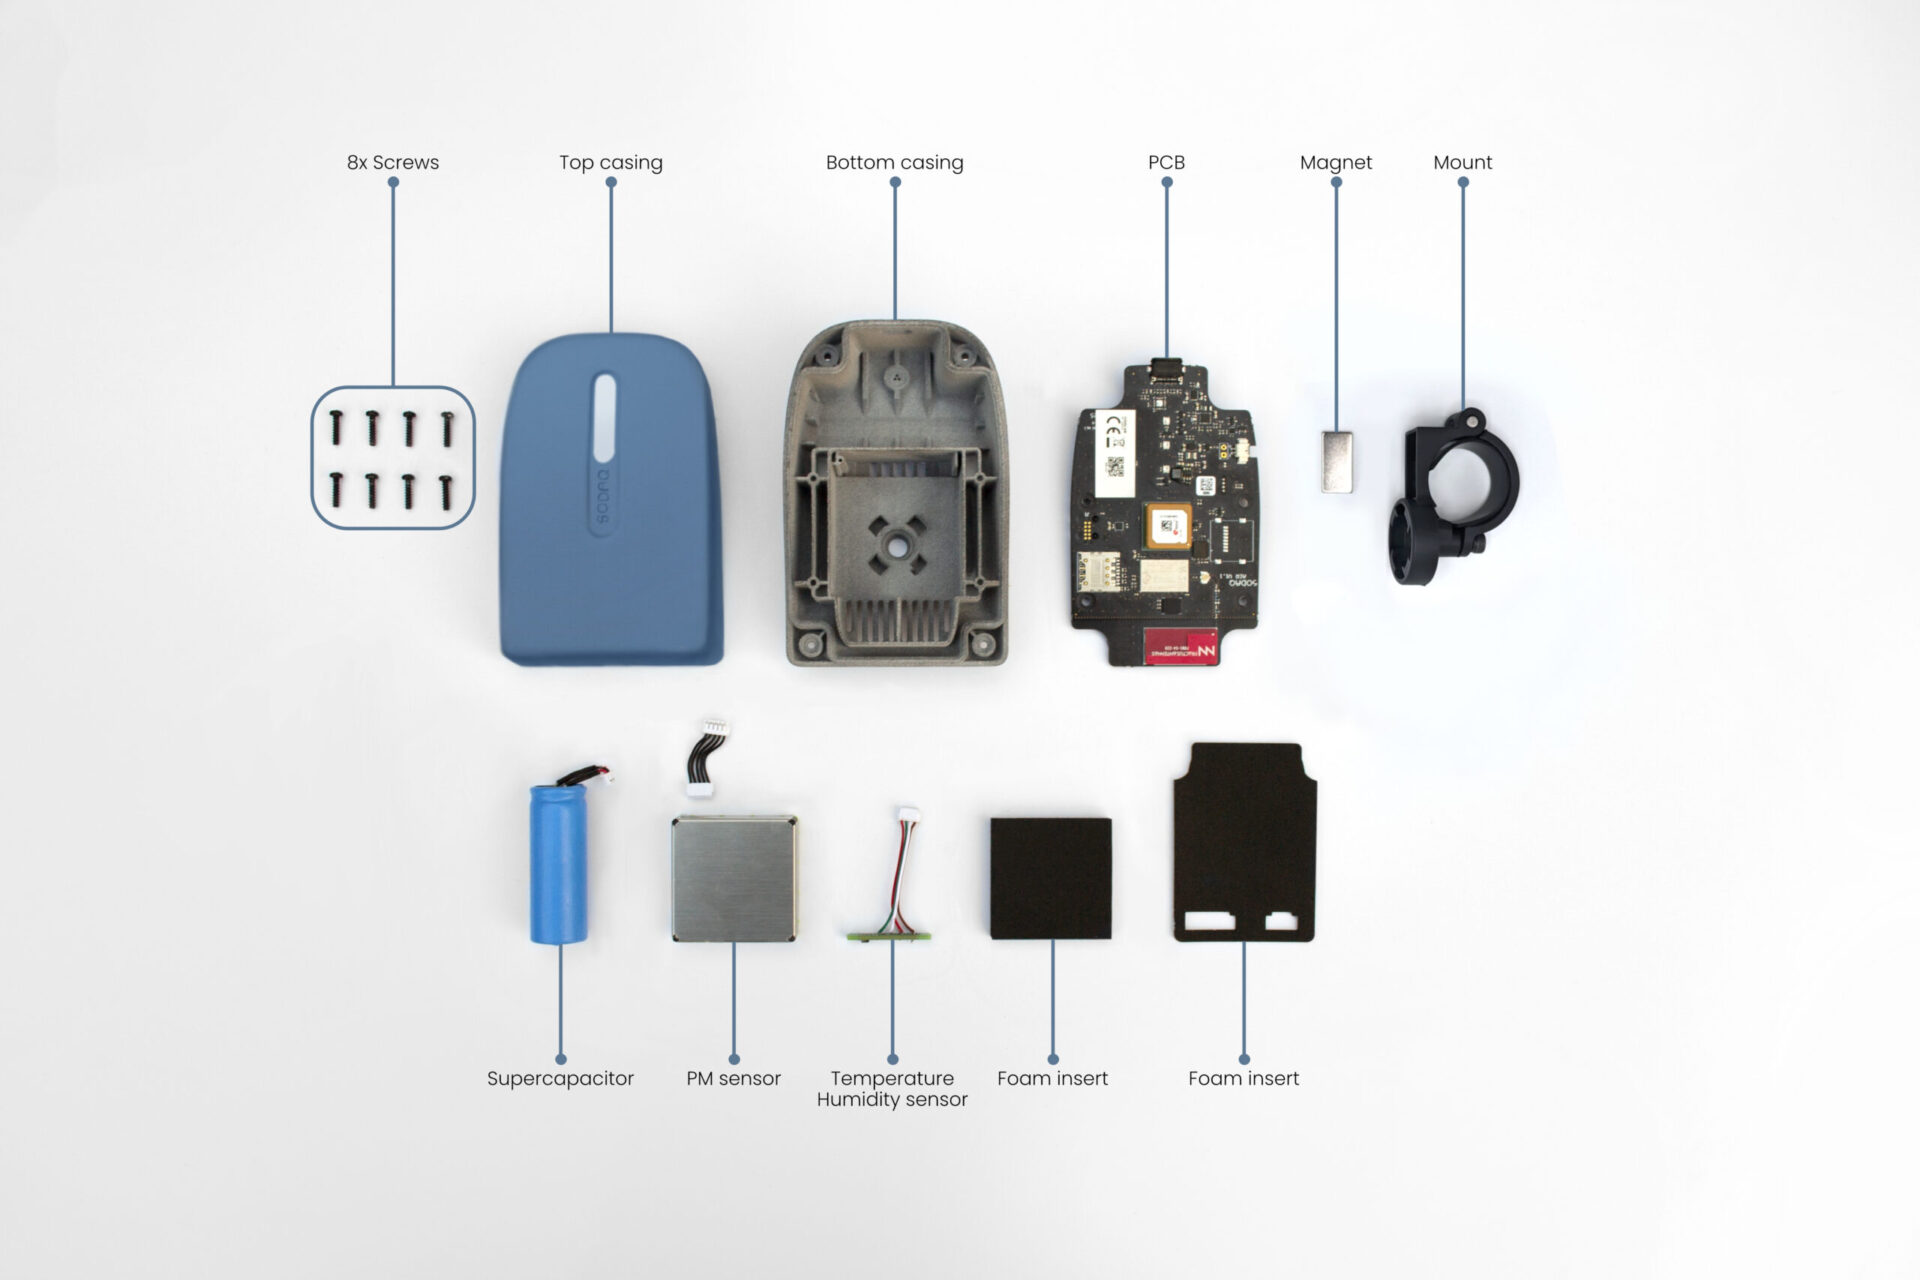
Sensor
State-of-the-art PM sensor that measures particle parameters including PM1, PM10, with a primary focus on PM2.5.
Humidity & Temperature
The concentration of particulate matter is directly linked to the temperature and water content of the air. With the AIR’s advanced sensors you can get a complete understanding of those parameters and the resulting changes in air quality.
GPS
A smart GPS that tracks and records air quality levels while on the move.
Personalized data to help you identify problematic areas you encounter daily and to monitor exposure.
LED
Indicator
Easy to understand LED light strip that changes color to communicate real-time air quality changes.
Accelerometer
Never miss a journey with motion technology that signals sensors to begin recording upon detecting movement.
Stops recording data automatically when the AIR speed reaches above 50km/h (car or train).
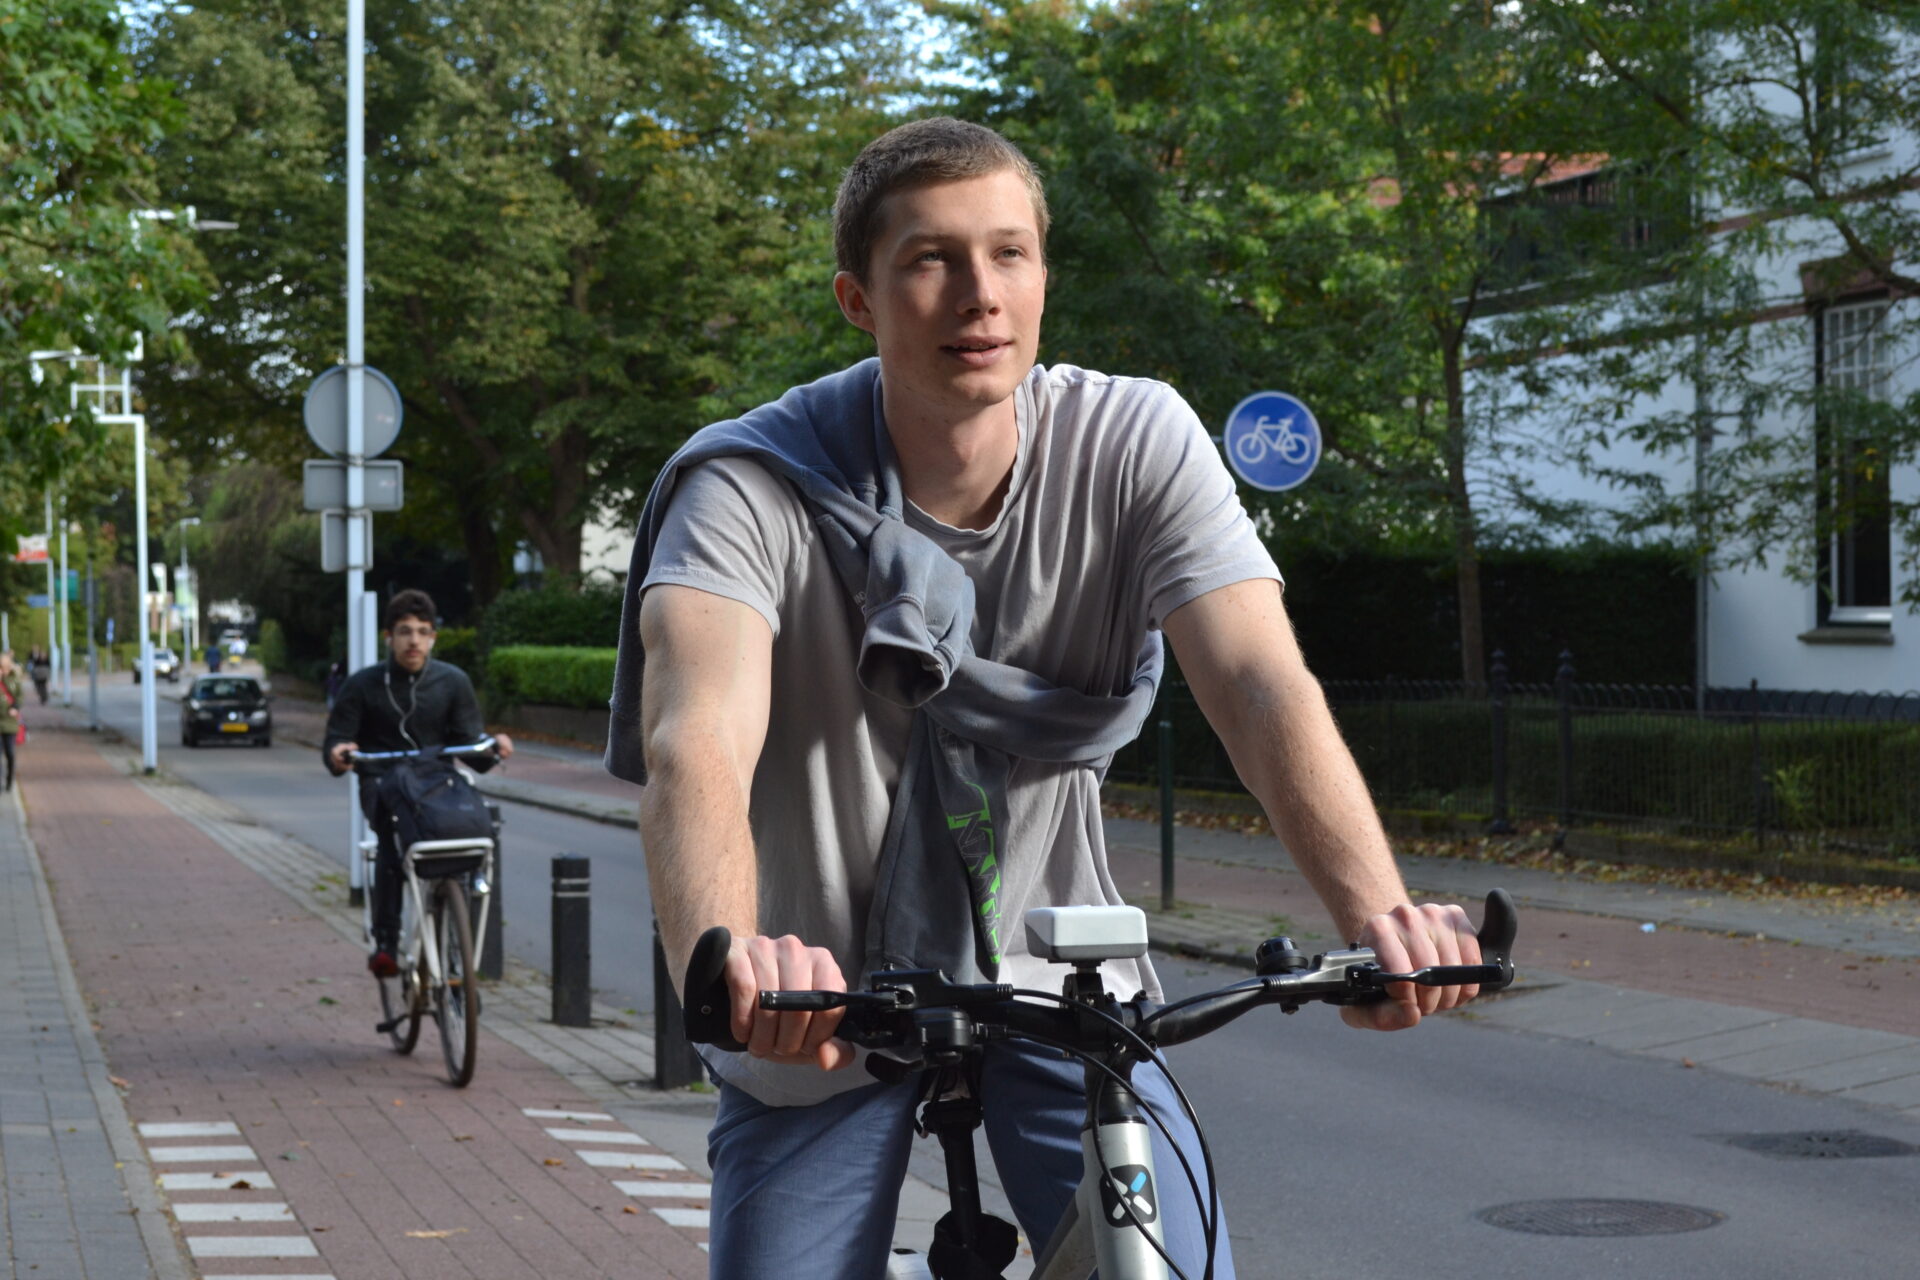
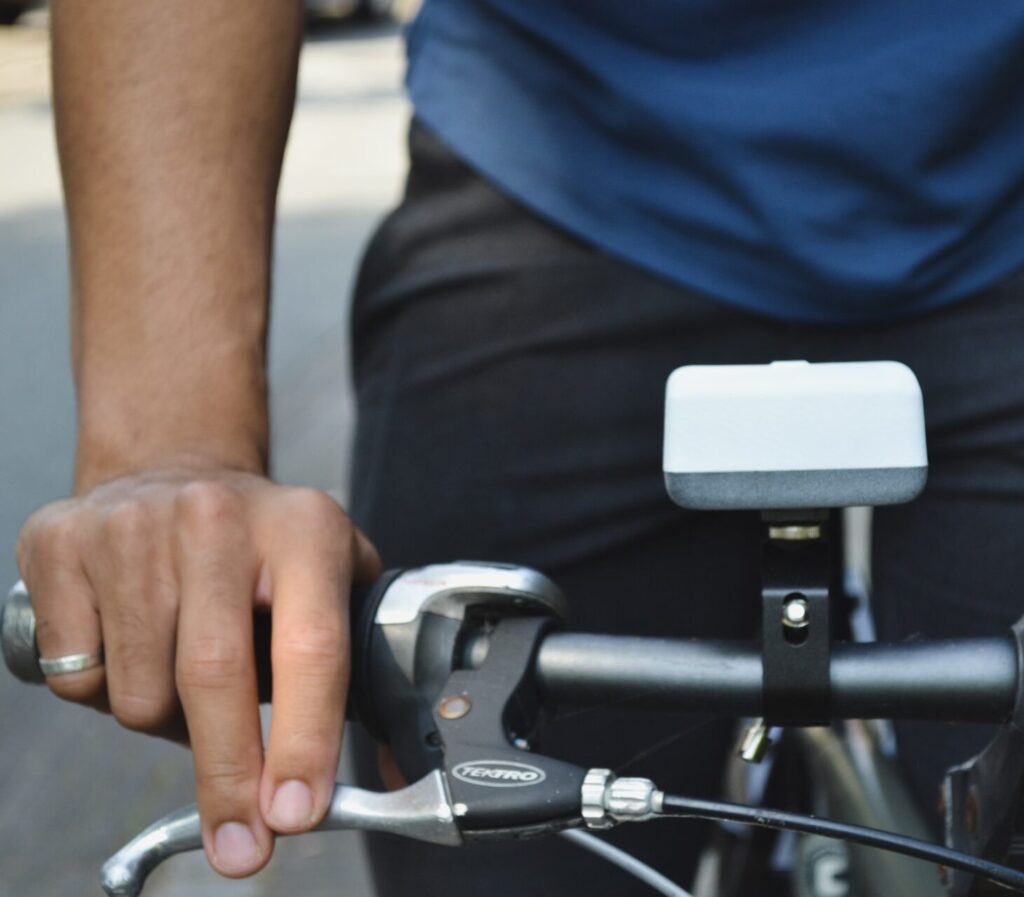
REAL-TIME AIR QUALITY MONITOR AT YOUR FINGERTIPS
A highly intuitive air quality monitor, designed to help everyone, everywhere understand the quality of the AIR.
For long-distance transportation of goods, swap bodies have become an invaluable tool for many businesses around the world. However, its flexibility comes with logistical challenges: Risk for theft and loss, complex planning and lack of visibility in the absence of options to power tracking devices. For this, SODAQ developed the TRACK Extreme, a robust solution that thrives in rough environments.
For who?
Logistics and transport organizations that move goods over long-distance using non-powered containers and are looking to gain back control and optimize their planning.
What?
Reliable connectivity via LTE-M or NB-IoT and offering 2G fall back
Solar panel, allowing for low maintenance and autonomous tracking for up to 20 years
A robust design and IP69-rated case, made for rough environments
Tell me more
With the TRACK Extreme, supply chain managers are now able to monitor the location of their swap bodies and truck trailers in real-time. The Extreme sends data about the swap bodies and truck trailers to easily monitor and manage them more effectively. Easily understand which container carries which load. Receive a notification on delays. Find your cargo within seconds due to real-time tracking. The TRACK Extreme, in combination with the platform-agnostic Silica platform, offers it all.
Smart City
Make the invisible visible and put forward a citywide initiative to combat air pollution. SODAQ AIR can be supplied in bulk and distributed among local citizens to provide local leaders with actionable information to help achieve their clean air goals.
For who?
Local governments, municipal bodies, and smart city coordinators who are responsible for managing the community’s air quality. These community representatives want a true understanding of air pollution to implement data-driven strategies, new infrastructure, and targeted policies that mitigate or eliminate high levels of particulate matter.
What?
Fill the data gaps in conventional monitoring systems with real-time data at a community level.
Effectively narrow down pollution areas in your city where individuals work, live, and play.
Achieve a comprehensive air quality monitoring network that spans the entire city.
Tell me more
Bulk distribution of SODAQ Air helps build awareness and encourages community engagement in working towards smart city clean air solutions.
Large Organisations
Promote healthy living in your organization by providing employees with the ability to manage their air pollution exposure on their commute, at their place of work, and in between shifts. Organizations relish the benefits of higher employee engagement and positive reputations in the community.
For who?
Organizations looking to integrate clean air goals as part of their corporate social responsibility initiatives, and to empower their employees to work towards a collective mission.
What?
Encourage employees to bike more often with compact and dynamic sensors that collect data as they ride.
Have healthier, happier, and more productive employees that are highly engaged to give back to their community with air pollution mapping.
Leverage collected data for research purposes, or innovate solutions that support local governments in creating a healthier living environment.
Tell me more
Increase employee satisfaction and customer retention rates by gaining a positive brand image in the environment you operate in.
Reduce risk and loss and boost supply chain performance with real-time visibility. Integrate the SODAQ TRACK Stealth into reusable small containers and boxes moving through your closed loop supply chain, providing you with control over moving assets.
For who?
Organizations with closed-loop supply chains looking to increase transparency and streamline the flow of assets throughout both their own and customer facilities.
What?
Create a connected, transparent supply chain that delivers real-time visibility at every stage.
Receive location, motion or temperature threshold alerts, revealing the exact time and location.
Receive powerful data that enables you to make smarter supply chain decisions. With more control, you can minimize loss and waste, protect content integrity and reduce costs.
Tell me more
Using the TRACK Stealth allows you to monitor the temperature, motion and location of reusable supply chain assets. The Stealth is powered by a rechargeable supercapacitor which allows for an endless number of charging cycles and is able to power the device for up to 3 months.